Hay prices and forecast checks
As of September 19, 2026. All prices are dollars per short ton.
Southeast Colorado since January
The dots below are reported alfalfa prices. In the statewide panel, months USDA has not yet released carry our own frozen estimates as open points, so the chart never goes blank where we have made a call. Different grades and sale terms are shown separately. We do not have a continuous local price series: only eight 2026 reports are saved. January–March and May have no report coverage; April 9 and September 10 have no Southeast per-ton alfalfa quote. Gaps do not mean no hay sold.


Our estimates versus a real local sale
The August 27 farm sale was $325/ton for 88 tons of Good/Premium large squares. Earlier August estimates were $235–245. That sale is a useful warning that our estimates were low, but it falls below the 100-ton grading threshold and is not an exact match for the earlier Premium target. We cannot honestly calculate a local monthly forecast error from it.
The August 27 forecast was written with that sale already known. The corrected September estimate is $270; there is no matching September sale here to grade it against.


Where we can measure forecast errors
Our statistical model predicts Colorado statewide all hay, a separate series. Compare it with the same USDA series. Using the last forecast saved before each month began, the model was low in all three months we can score. Average absolute error: $34.7/ton.

| Month | Forecast issued | Forecast | Actual | Forecast minus actual |
|---|---|---|---|---|
| May | 2026-04-18 | $162.9 | $189 | $-26.1 |
| June | 2026-05-14 | $172 | $208 | $-36.0 |
| July | 2026-05-14 | $180 | $222 | $-42.0 |
The three forecasts have different lead times. This small sample does not establish model reliability. Actuals use the saved USDA series available as of September 19. For August and September, which USDA has not released, the statewide panel shows our frozen estimates as open points with their ranges: August $235 (range $170–300, frozen Aug 27, grades Sep 29) and September $240 ($210–270, grades Oct 30). Forecasts made during or after the target month are excluded.
Local observations behind the graph
Dates below are report dates, not exact transaction dates. Repeated asks and contracts may refer to the same lot. No per-bale quotes were converted to dollars per ton.
| Report date | Grade | Bale | Tons | $/ton | Terms | Status |
|---|---|---|---|---|---|---|
| 2026-06-04 | Ungraded | Large Square 4x4 | 2000 | $225 | Delivered-Feedlot | Contract (Trade) |
| 2026-06-04 | Premium | Medium Square 3x3 | 23 | $270 | F.O.B.-Stables | Trade |
| 2026-07-02 | Ungraded | Large Square 3x4 | — | $250 | F.O.B. | Ask |
| 2026-07-02 | Ungraded | Large Square 4x4 | 2000 | $225 | Delivered-Feedlot | Contract (Trade) |
| 2026-07-16 | Ungraded | Large Square 3x4 | — | $250 | F.O.B. | Ask |
| 2026-07-30 | Ungraded | Large Square 3x4 | — | $250 | F.O.B. | Ask |
| 2026-07-30 | Good/Premium | Large Square 3x4 | 25 | $300 | F.O.B.-Stables | Trade |
| 2026-08-13 | Ungraded | Large Square 3x4 | — | $250 | F.O.B. | Ask |
| 2026-08-13 | Premium/Supreme | Large Square 3x4 | 25 | $350 | F.O.B.-Stables | Trade |
| 2026-08-13 | Premium/Supreme | Medium Square 3x3 | 23 | $380 | F.O.B.-Stables | Trade |
| 2026-08-13 | Good/Premium | Large Square 3x4 | 25 | $300 | F.O.B.-Stables | Trade |
| 2026-08-13 | Utility/Fair | Large Square 3x4 | 23 | $285 | F.O.B.-Farm/Ranch | Trade |
| 2026-08-27 | Good/Premium | Large Square 3x4 | 88 | $325 | F.O.B.-Farm/Ranch | Trade |
Saved report dates: 2026-04-09, 2026-06-04, 2026-07-02, 2026-07-16, 2026-07-30, 2026-08-13, 2026-08-27, 2026-09-10.
Sources and older graphs
These charts use saved USDA AMS Colorado Hay Report 2905 observations and USDA NASS Agricultural Prices. The AMS link is a rolling report, not a permanent copy of every date. The original dated source references and the numbers plotted are in the chart data download.
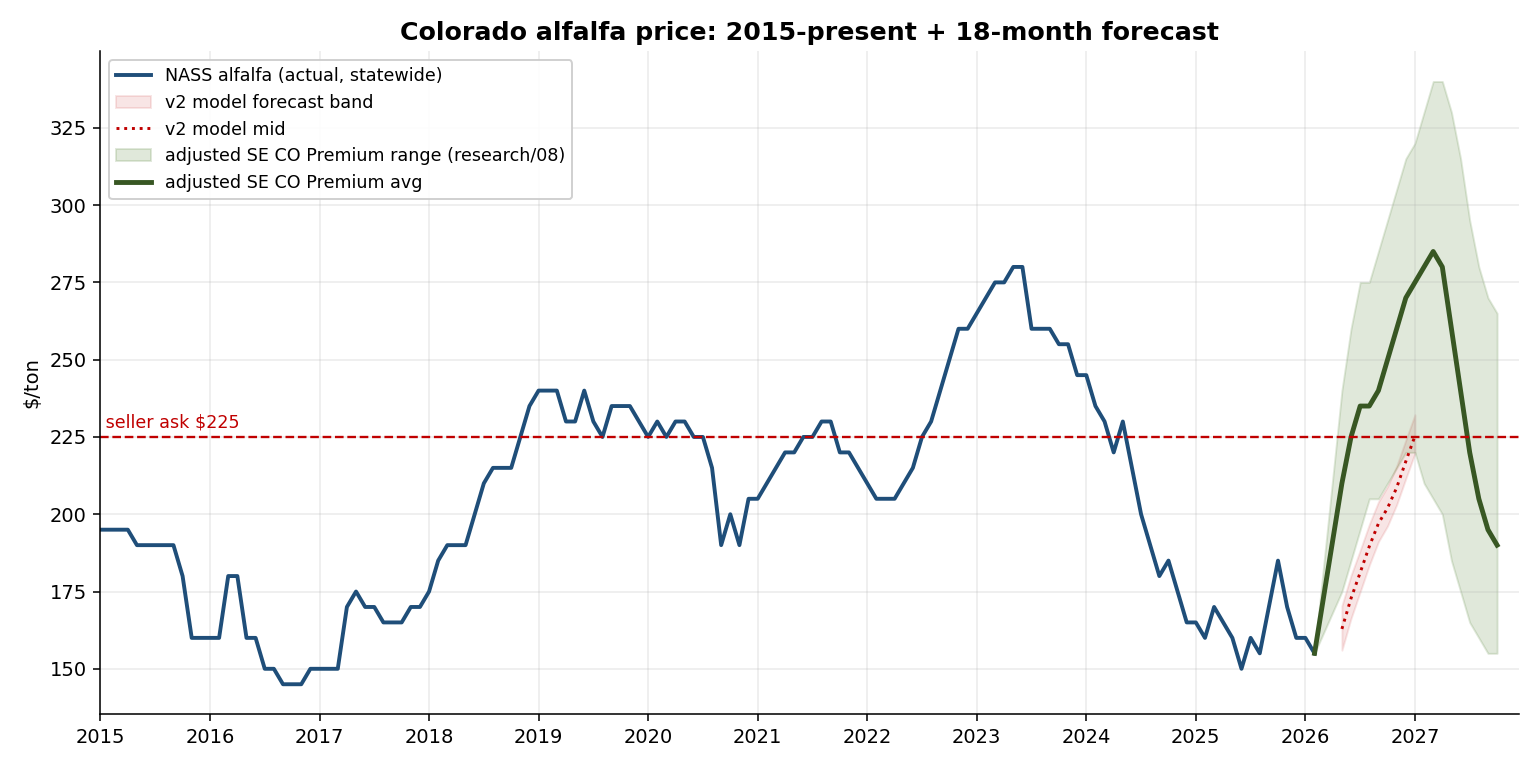
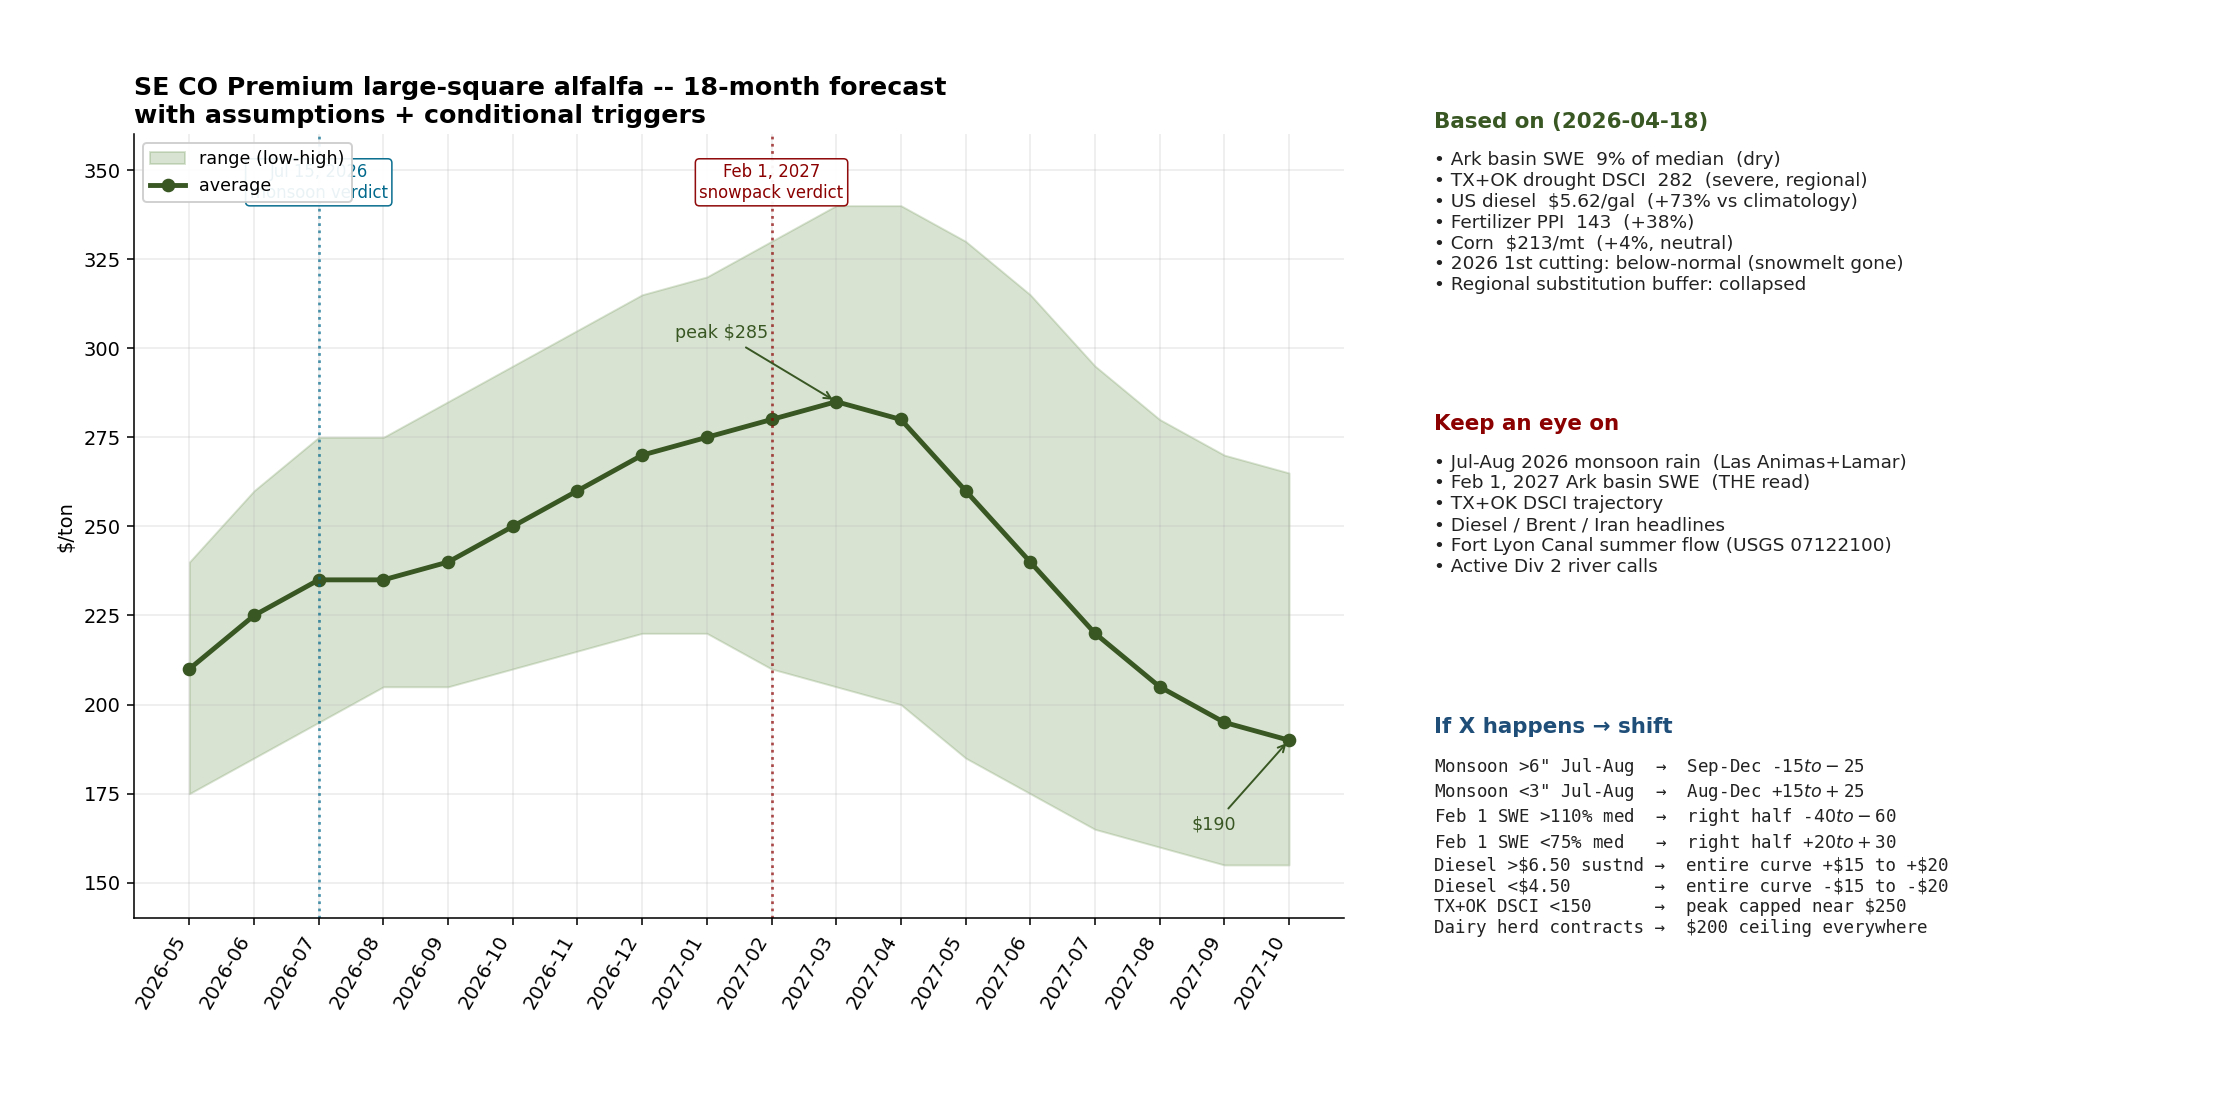
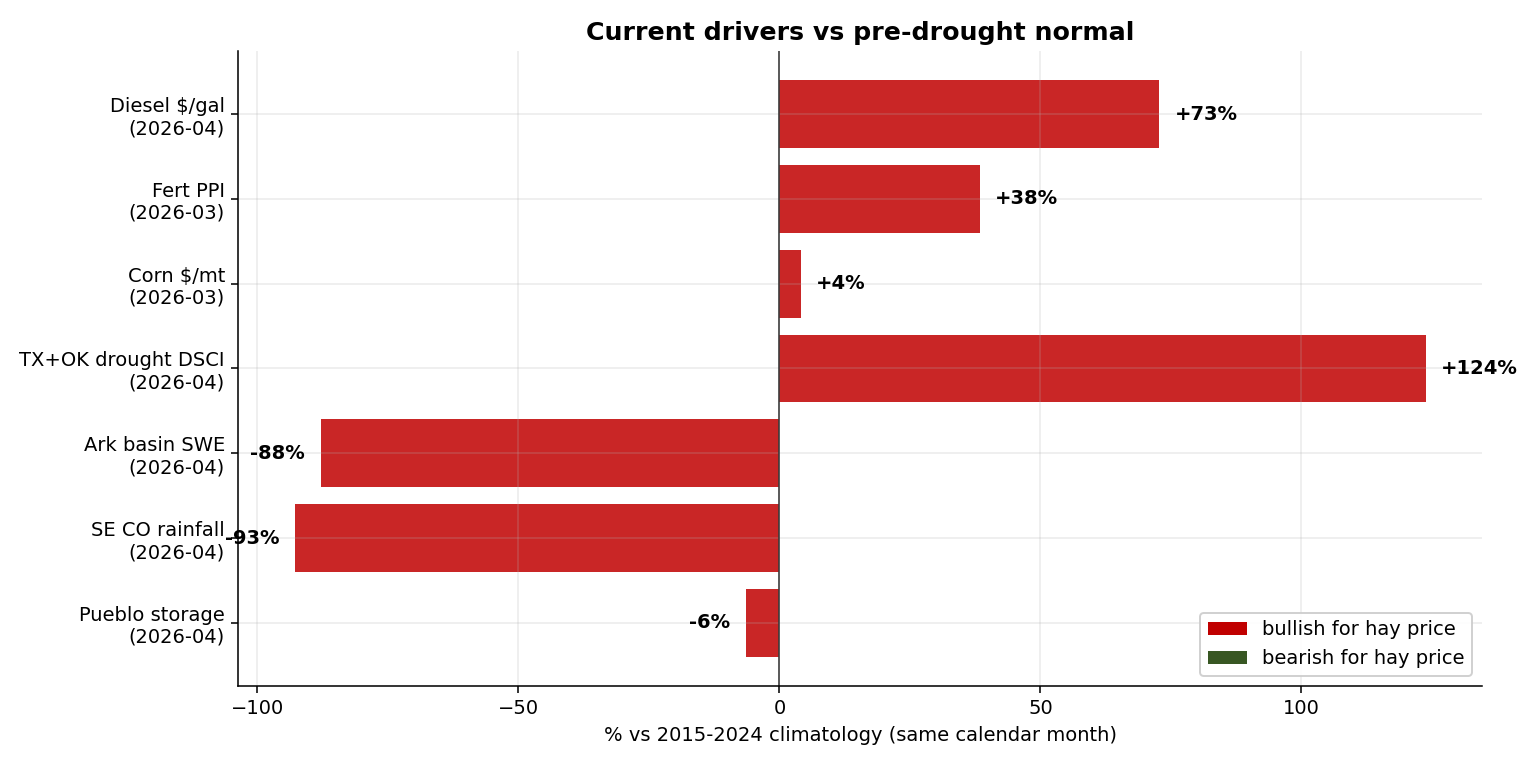
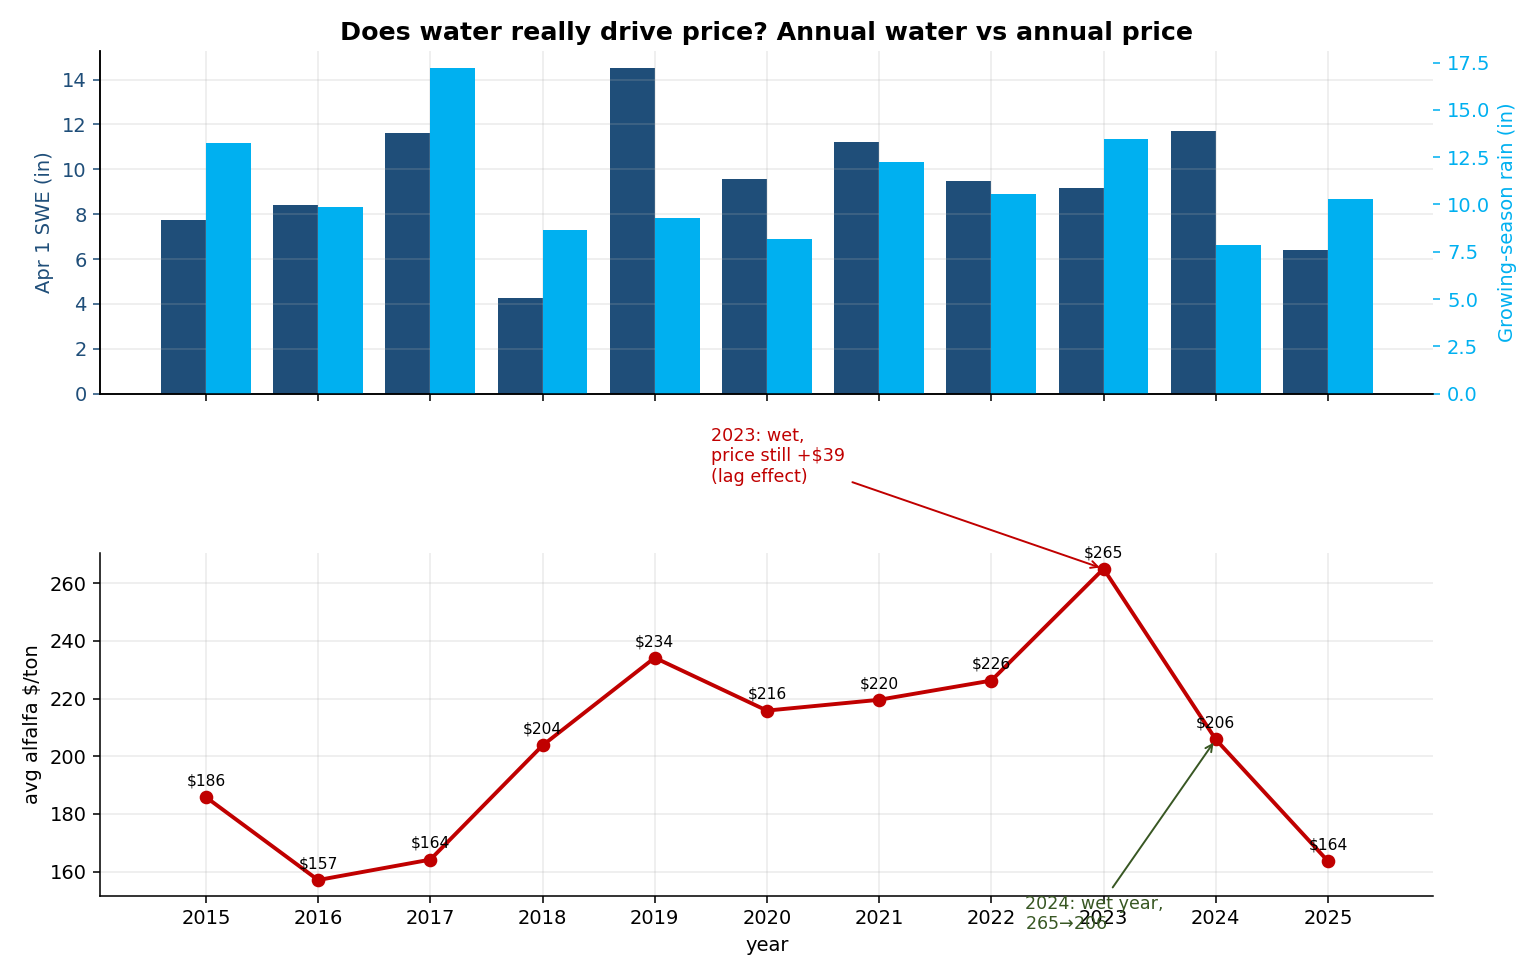
The earlier graphs still exist. They were linked from old reports, which made them hard to find. These are frozen April views, not current forecasts:
- April price history and forecast
- April model versus adjusted forecast
- April input anomalies
- April water versus price history
The new graphs preserve old estimates and add observed prices separately, so later revisions cannot erase earlier misses.