April 2026 Forecast & Watchlist
Written: 2026-04-18 Supersedes the numeric ranges in: 07-pricing-strategy-2026.md (which still holds for the tranche strategy, psychology, and decision logic). Companion to: data/historical/combined_monthly.csv (model output) and dashboard.html (live plot).
This is my honest best-guess price path for SE Colorado Premium large-square alfalfa (what the McClave seller's hay competes as), along with the signals to watch that will tell us whether we land on the low end or the high end. Prices are $/ton, ex-stack SE Colorado.
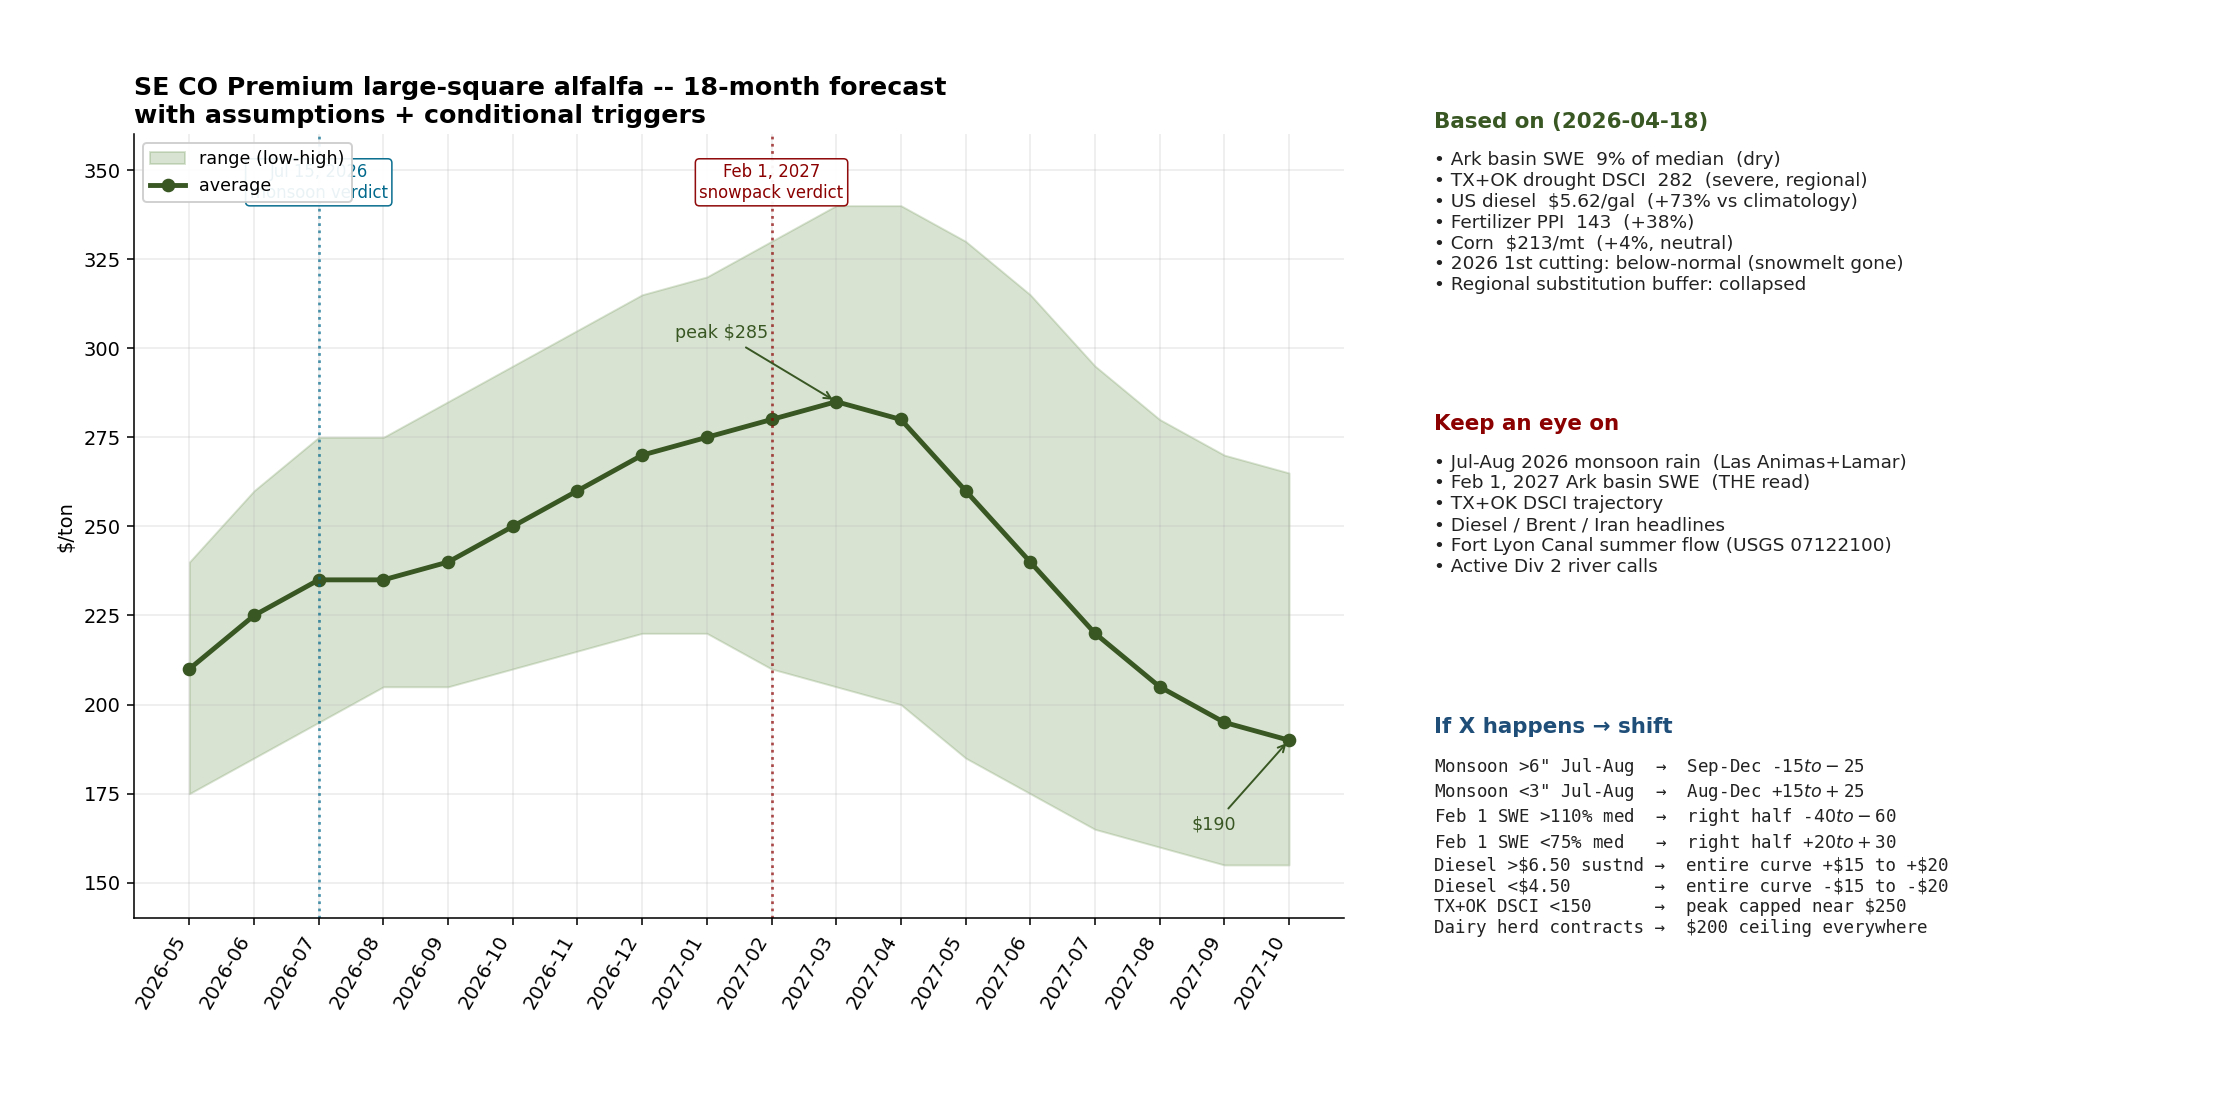
The headline forecast
``` LOW AVG HIGH notes 2026-05 May $175 $210 $240 2026-06 Jun $185 $225 $260 2026-07 Jul $195 $235 $275 2026-08 Aug $205 $235 $275 ← near-term peak 2026-09 Sep $205 $240 $285 2026-10 Oct $210 $250 $295 2026-11 Nov $215 $260 $305 2026-12 Dec $220 $270 $315 2027-01 Jan $220 $275 $320 2027-02 Feb $210 $280 $330 ← snowpack verdict week 2027-03 Mar $205 $285 $340 ← peak spring carryover 2027-04 Apr $200 $280 $340 2027-05 May $185 $260 $330 ← first 2027 cutting 2027-06 Jun $175 $240 $315 2027-07 Jul $165 $220 $295 2027-08 Aug $160 $205 $280 2027-09 Sep $155 $195 $270 2027-10 Oct $155 $190 $265 ```
Reading the shape:
- Rising wedge May 2026 – Feb 2027. Supply damage hardens with each dry month; carryover scarcity compounds; drought premium builds.
- Maximum uncertainty Feb–Apr 2027. This is the verdict window for the 2026–27 snowpack. The low column drops sharply (relief rally) while the high column keeps climbing (two-year drought scenario).
- Reversion in summer/fall 2027. New 2027 crop either arrives normally (price falls toward pre-drought ~$180–200) or confirms drought-two (price stays $250+). Averages weighted ~60/40 toward relief.
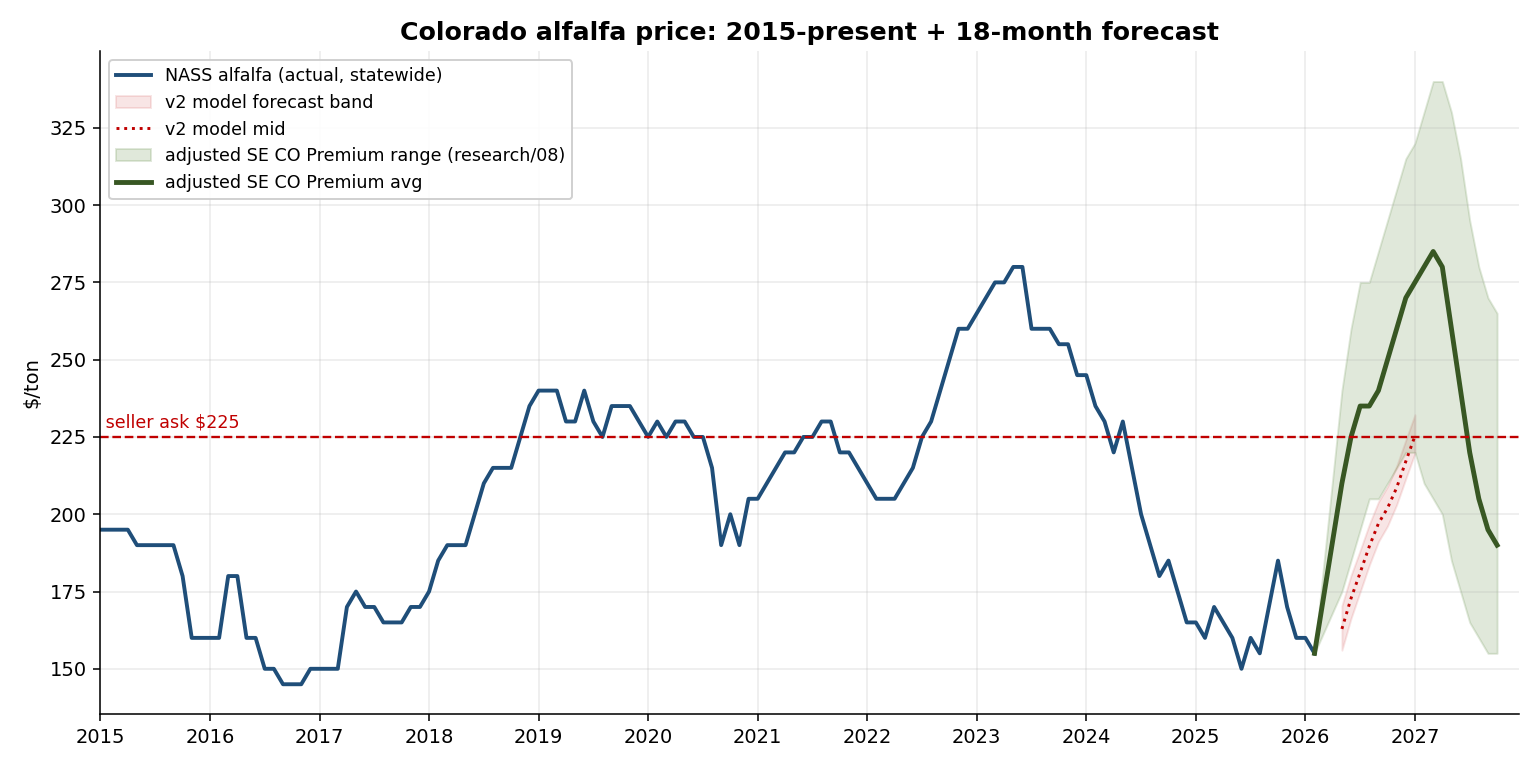
How these numbers differ from the v2 model
The forecast_prices_v2.py model (backtest MAE $22/ton) produces a mid-forecast of roughly $163 → $225 from May 2026 to Jan 2027. My averages above are $210 → $275 — consistently $30–50/ton higher.
Three reasons I adjusted up:
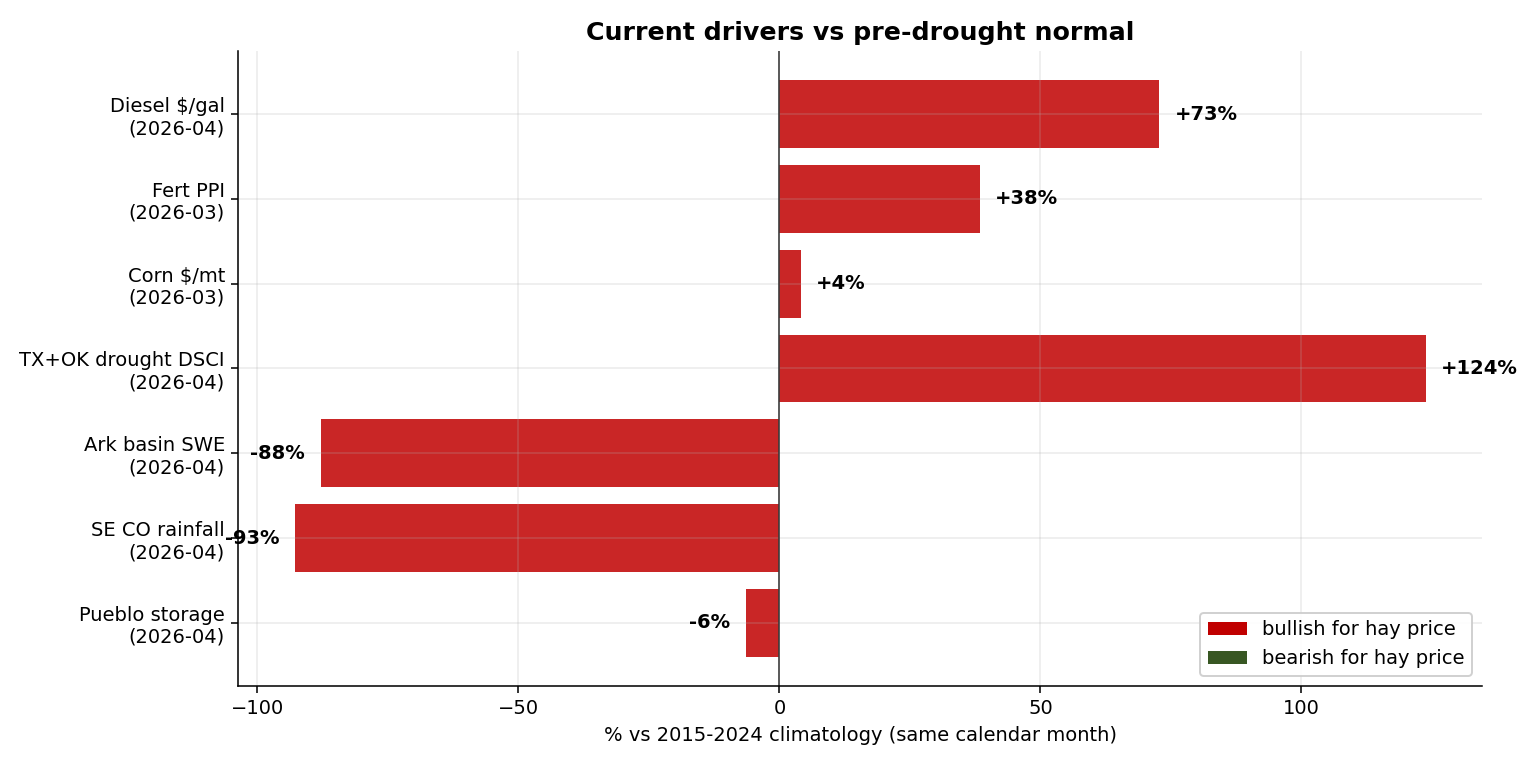
- The model was trained on 2015–2024, where the worst drought year had Arkansas basin SWE around 60–70% of normal. 2026 is at 9%. The model extrapolates linearly past its training distribution, but physical hay supply curves go vertical in genuine scarcity.
- Regional substitution has collapsed. TX+OK DSCI is at 282 simultaneously with a gone Upper Arkansas snowpack. The model treats txok_dsci as one smooth coefficient; it doesn't model the regime shift where southern-plains dairies start bidding into SE Colorado.
- The model holds macros flat forward. If Iran/Brent pushes diesel from $5.62 to $6.25+, add another $10–15/ton via trucking and on-farm fuel.
The model is honest within its training range. My deltas are reasoned, not backtested — see the "what I can and can't defend" section below.
Confidence by window
| Window | Confidence | Why |
|---|---|---|
| Aug 2026 ($215–275 band) | High | 2026 physical supply is mostly locked in now — too late for summer rain to fully rescue it. |
| Nov 2026 – Jan 2027 ($250–320) | Medium | Carryover math gets clearer; depends on how aggressively dairies contract early. |
| Feb–May 2027 ($200–340) | Low | One number — winter snowpack — swings this window by $100+/ton. |
| Summer–fall 2027 ($155–295) | Low-medium | Path-dependent on the preceding winter; both paths plausible. |
What I can and can't defend about the rainfall-price relationship
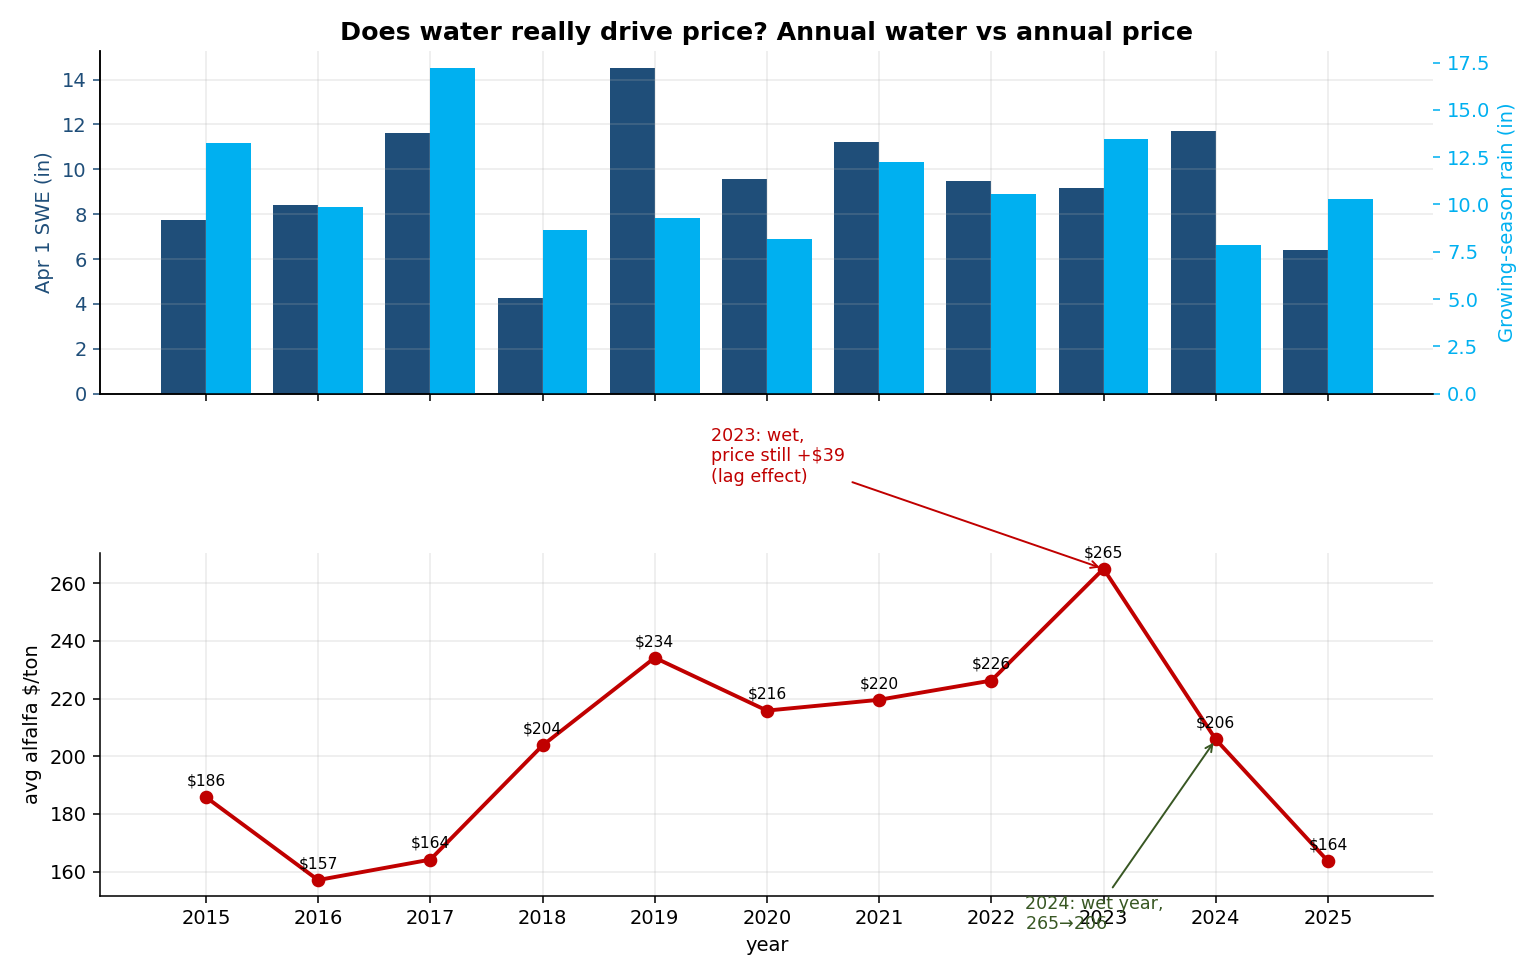
The v2 model as a whole backtests at $22/ton MAE. My specific scenario sensitivities (e.g. "wet 2026–27 winter → −$40 to −$60 on spring 2027") are reasoning, not a rigorous backtest on analogous cases.
What the annual data actually shows:
``` year GS rain Apr SWE avg $/ton what happened 2018 8.6 4.3 204 DRY → +$40 ✓ rain-down-price-up works 2023 13.4 9.2 265 WET → +$39 ✗ breaks simple thesis 2024 7.9 11.7 206 DRY → -$59 ✗ breaks simple thesis 2025 10.3 6.4 164 DRY → -$42 ✗ ```
"More rain this year → lower price this year" is not clean at annual resolution. Model coefficients confirm it: rain_anom coefficient is +0.20, swe_anom is +0.28 — both practically zero. lag1_price (+0.96) swallows the short-term momentum. Water relief works on a multi-year delay.
The single best historical precedent for "water abundance kills price": 2024. April SWE at 11.7" (above normal) after the 2022–23 drought spike knocked Colorado alfalfa from $265 → $206 in one year — −$60/ton on one good snowpack year. That's the one data point anchoring my spring-2027 low-end scenario.
Counter-evidence: 2023 had decent snowpack and rain, yet prices surged +$39. Why? Because the 2022 damage + macro shock were still in the system.
The honest takeaway for the seller: a summer thunderstorm will not crush the price. The input that historically has moved prices sharply downward is a full above-normal winter snowpack. That risk lives in the last tranche of a stack held through winter, not in the tranches sold by fall.
Watchlist — what to check to know low-end vs high-end
Tier 1 — The big three (these carry most of the forecast uncertainty)
| Signal | Source | Low-end trigger | High-end trigger |
|---|---|---|---|
| 2026–27 Arkansas basin SWE (Dec–Feb) | NRCS SNOTEL basin index | >110% of median by Feb 1 → spring 2027 collapses toward $200 | <75% = two-year drought confirmed → Apr 2027 pushes $320+ |
| Summer 2026 monsoon (Jul–Aug rain) | Las Animas + Lamar COOP cumulative | >6" combined → 2nd/3rd cuttings rescued, Aug drops into low $200s | <3" = one-cutting year locked → Aug pushes $270+ |
| TX + OK drought DSCI | USDM weekly | Drops <150 = regional pull evaporates | Stays >250 = Panhandle dairies keep bidding |
Tier 2 — Cost-push macros (FRED series)
| Signal | FRED series | Low trigger | High trigger |
|---|---|---|---|
| US retail diesel | GASDESW | <$4.50 | >$6.00 (Iran/Brent shock) |
| Nitrogenous fertilizer PPI | WPU0652013A | <120 | >160 sustained |
| Global corn $/mt | PMAIZMTUSDM | <$180 | >$250 (feed-grain competition) |
Tier 3 — Local reality checks (McClave-specific)
| Signal | Source | What to watch |
|---|---|---|
| Fort Lyon Canal flow | USGS site 07122100 | Avg summer cfs <40% of prior year = neighbors short on water |
| John Martin storage | USACE morning report | Drops below 30k AF = lower-basin crisis intensifies |
| Active Div 2 river calls | CDSS Division 2 dashboard | Drops <15 = improving; stuck at 25+ = tight |
| ENSO state | NOAA CPC monthly | La Niña persisting = dry SW bias; El Niño emerging = relief |
How to actually use the watchlist
- Weekly (Mondays): Diesel (GASDESW), USDM, Div 2 call count. 30-second check.
- Monthly: NRCS Arkansas basin SWE, NASS monthly hay prices, corn + fert PPI.
- Operational:
scripts/update_weekly.shrefreshes most of these and regeneratesdashboard.html. Dashboard Panel 3 (features vs climatology) is exactly this watchlist in live form.
Decision checkpoints
| Date | Signal resolves | Action |
|---|---|---|
| 2026-07-15 | Monsoon onset / 2nd cutting outlook | Decide middle tranche (hold vs. sell) |
| 2026-10-15 | 3rd cutting in, early-snowpack read, dairy contracts forming | Decide on winter-holding tranche |
| 2027-02-15 | Arkansas basin Feb 1 SWE published (~2 weeks prior) | Final decision on last tranche. Single most consequential read of the whole cycle. |
If I had to watch just one number
Arkansas basin SWE on February 1, 2027. That one reading has more signal than all the others combined for whether spring-2027 carryover trades at $205 or $340.
Cross-references
research/07-pricing-strategy-2026.md— three-tranche sell plan, psychology, timing triggers. Numeric price targets in that doc are superseded by this doc's table.data/historical/combined_monthly.csv— model (not my-adjusted) forecast, columnsforecast_low/mid/high.data/historical/forecast_history.csv— week-over-week log of the model's forecast for each target month (built up byupdate_weekly.sh).dashboard.html— live visualization: price panel, forecast-drift panel, features-vs-climatology panel.INDEX.md"Key numbers to watch" table — live readings of most Tier 1/3 signals.